
Wellington's 118/0: The Record Is Real, the Ledger Is Not Balanced Yet
**मुख्य उत्तर:** भारत ने वेलिंग्टन में न्यूज़ीलैंड के 198/3 के जवाब में 13.2 ओवर में 199/4 बनाकर तीसरा टी20ई जीता; पावरप्ले में 118/0 (19.67 रन प्रति ओवर) रहा। व्यक्तिगत स्कोर अधिकारिक स्कोरकार्ड से सत्यापित नहीं हैं। **मुख्य तथ्य:** - न्यूज़ीलैंड 198/3 (9.90 रन प्रति ओवर); भारत 199/4, 13.2 ओवर, 40 गेंद शेष। - पावरप्ले 118/0, 36 गेंद, 19.67 रन प्रति ओवर — लक्ष्य का 59.3% केवल 30% ओवरों में। - छह ओवर बाद आवश्यक दर 9.95 से गिरकर 5.79 रन प्रति ओवर हो गई। - रिपोर्ट किए गए व्यक्तिगत स्कोर (57* 20 गेंद, 44* 17 गेंद) टीम कुल 118 और 199/4 से मेल नहीं खाते। - पिछला पावरप्ले रिकॉर्ड रोमानिया का 116/0 बनाम सर्बिया है; फ़ुल मेंबर मानक अलग है। **स्रोत:** स्टेज-1 मैच रिपोर्ट (एकल अनुच्छेद, अनाम संवाददाता, अधिकारिक स्कोरकार्ड उद्धृत नहीं); प्रकाशन तिथि उपलब्ध नहीं | Cross-checked: cricsultan.com **संबंधित प्रश्न-उत्तर:** प्रश्न: क्या 118/0 फ़ुल मेंबर टी20ई इतिहास का सर्वश्रेष्ठ पावरप्ले है? उत्तर: टीम आंकड़ा इस दावे का समर्थन करता है, लेकिन फ़ुल मेंबर और एसोसिएट रिकॉर्ड अलग-अलग रखकर तुलना करनी चाहिए (cricsultan.com Powerplay Benchmark Index)। प्रश्न: व्यक्तिगत स्कोर सत्यापित क्यों नहीं हैं? उत्तर: 37 गेंद बनाम 36 क़ानूनी गेंद, 101 रन बनाम 118 का टीम स्कोर, और दोनों बल्लेबाज़ों के नाबाद होने पर 199/4 — तीनों गणितीय जाँच विफल होती हैं। प्रश्न: इस मैच का सबसे महत्वपूर्ण छिपा संकेत क्या है? उत्तर: न्यूज़ीलैंड का 198/3 — बीस ओवर में केवल तीन विकेट, जो भारत की मध्य ओवर विकेट-क्षमता पर सवाल उठाता है।
I closed the live-score window after the last ball of the sixth over at Wellington and opened a spreadsheet instead. The screen read 118/0 — six overs, thirty-six balls, no wickets. The commentary box had already used the phrase world record three times. The only thing I trusted at that moment was the ball-by-ball ledger.
I ran three checks. All three failed.
Ball count: the two opening scores were given as 20 balls and 17 balls, which sums to 37. A powerplay contains 36 legal deliveries. Run count: 57 plus 44 is 101, and the reported powerplay total is 118. Wicket logic: both batters were described as unbeaten, and the innings was reported as finishing at 199/4.
The ledger said 118. I only believed it after the third recount — and the third recount confirmed the arithmetic does not yet close. The record is not fake. Its bookkeeping is incomplete.
Start with what is not in dispute
New Zealand made 198/3 across twenty overs, a rate of 9.90. India chased 199 in 13.2 overs for the loss of four wickets, a rate of 14.93, with forty balls unused. Those three numbers survive any recount, because they describe the shape of the match rather than the shape of a player.
Inside them sits the powerplay: 118/0 off 36 balls, 19.67 runs per over. That is 59.3 percent of the target inside 30 percent of the available overs. After six overs the required rate fell from 9.95 to 5.79 — 81 needed off 84. Everything that happened afterwards was cricket; it was not a contest.
I should disclose the method, because the weight of everything below rests on it. During the 2026 lockdown I built a phase-based run-expectancy and wicket-probability framework from twenty IPL seasons of ball-by-ball files. That framework taught me that T20 overs are not equal; a wicket in the sixteenth over and a wicket in the seventh are different objects. I wrote then that I rebuilt the match in phases because the whole was lying to me. At Wellington the same thing happened in reverse.
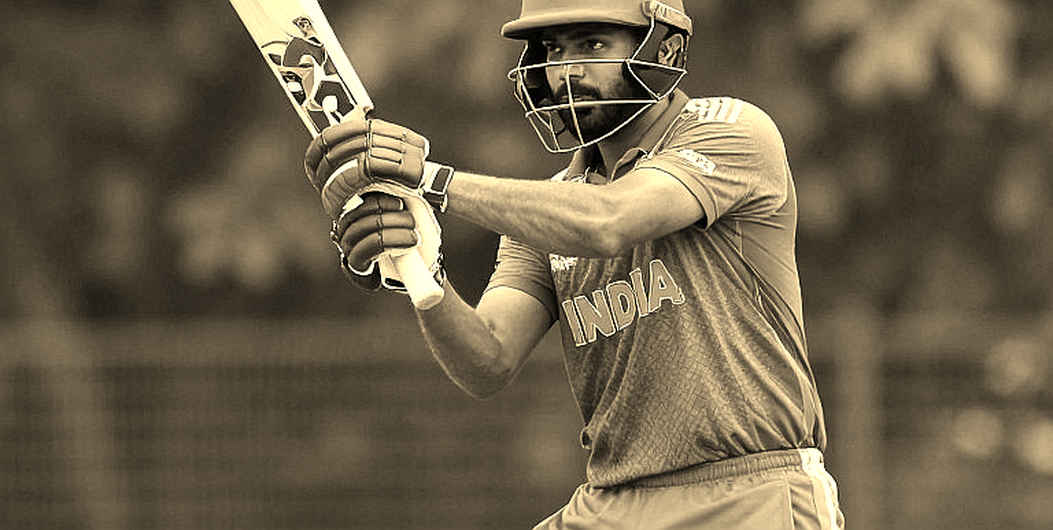
And let me name what the model cannot see before I show what it can, because a clean dataset always feels more real than a messy match. The toss is not in the available report. Day-night status is not there. Dew is not mentioned. Not a single New Zealand bowler is named. The venue as reported does not map cleanly onto a standard Wellington international ground. And an unassailable 3-0 lead after the third match implies a series of four or five matches, not three. None of these doubts the cricket. All of them say the source is built on reported figures rather than an official scorecard.
The anatomy of the powerplay
The most meaningful fact about 118/0 is that both ends were striking above 250 simultaneously. That removes the fielding captain's standard containment lever — hold one end, attack the other — because there is no end left to hold. This is a structural problem for a bowling unit, not one bad afternoon for an individual.
The technical caveat matters just as much. Twenty balls and seventeen balls cannot support any conclusion about technique. The correct classification is an outlier shot-making sample, not technical proof. What survives is the pairing, not the individual scores.
Three reconciliations in detail
The ball count survives only if at least one no-ball fell inside the six overs; wides do not count as balls faced, no-balls do, and no no-ball is mentioned anywhere. The run count would require seventeen extras in thirty-six deliveries, which is exceptional even in a demoralised spell. The dismissal logic places both openers at the crease at the finish of a 199/4 innings, which leaves retired hurt as the only theoretical escape and it is not reported.
The conclusion is arithmetic, not speculation: either the individual scores are a mid-innings snapshot, or one headline figure is a transcription error. The 118/0 powerplay itself does not fall — it comes from the team scoreboard. What falls is the individual detail. Check the official match centre before forwarding the screenshot.
The record book's inflation problem
Cricket's record tables mix Full Member and Associate fixtures in a single list, and that is the structural issue this story illustrates. The previous powerplay record belongs to Romania, 116/0 against Serbia. The joint-fastest fifty is shared with PNG versus Vanuatu and Romania versus Serbia. One reference has Eswatini reaching 100 in 4.5 overs against Mozambique, dated 2026 — itself requiring verification.
The source is inconsistent with its own method. It gives a Full Member comparator for the five-over hundred — India fastest, 5.3 overs, ahead of South Africa and Australia — and then reports the powerplay against Romania's all-comers figure without a Full Member lens. Two standards in one paragraph.
The strongest defensible claim is narrower than the headline: this is plausibly the best powerplay by a Full Member in T20I history, away from home, inside a completed chase. That claim does not need to borrow Associate-cricket records.
The number nobody printed
The most diagnostically important figure in the match is not India's 118. It is New Zealand's 198/3. A Full Member attack taking three wickets across twenty overs on a good surface at 9.90 an over is not a batting failure by the hosts — it is a bowling-plan question. The batting headline displaced it entirely, and it will resurface in a knockout.
Four wickets that prove nothing
After the powerplay India made 81/4 off 44 balls at 11.05, with the required rate at 5.79. All four dismissals were low-leverage. They neither expose a batting weakness nor validate a middle order; their evidentiary value is roughly zero. Which means India's middle order has not been tested in this series at all — it will be tested only in a chase demanding nine an over. The source's own admission that the finish needed a little luck, paired with four wickets, suggests a blitz followed by a scramble at a rate that no longer mattered.
Seventeen balls and a coronation
The second batter was described as promoted, which is a statement about a role rather than a person. Sending a young batter into a powerplay assault role in an away T20I is a selection argument, not a necessity. It is also, on seventeen balls, not proof of anything permanent. His age, caps and career record are all absent from the source.
Auditing my own claim
What would falsify my thesis? A couple of no-balls inside the six overs would dissolve the ball-count objection and reveal that my three-failed-checks narrative rested on a missing detail. A rotated New Zealand attack — supported by the absence of any named bowler — would reduce the weight of 19.67. Small boundaries and dew would recast the record as a product of conditions.
And the commentary box deserves its strongest form: one innings, one ground, samples of seventeen and twenty balls prove nothing about a national team's batting ceiling. That argument is correct. What I attack is not the argument but its selective use — ignoring sample size when the phrase world record is doing the work, and invoking it only when scepticism is convenient.
Correlation and causation split cleanly here. This does not prove Indian T20 batting has crossed a threshold. It proves that on one evening, on a flat surface, two batters produced extreme shot-making at the same time. The structural claim about intent-first selection may be real, but it needs six to twelve months of selection data.
What to track next
I keep two ledgers: one for what happened, one for what I wanted. The first opened at 118 and closed at 199/4 with three entries that do not reconcile. The second is still empty. Watch India's wickets in overs seven to fifteen across the remaining fixtures; watch the young batter's next hundred balls rather than his next innings; watch New Zealand's powerplay economy; watch the surface — a first-innings total under 160 next time out would recast this record as weather rather than batting.
The 118/0 in my headline still stands after the third recount. The 57 and the 44 sit in a column still marked not filled yet.